High-resolution mapping of amplicons in neuroblastoma using DNA microarrays.
|
Anne Fix1, Carlo Lucchesi1, Agnčs Ribeiro2, Delphine Lequin1, Gaëlle Pierron2, Gudrun Schleiermacher1,3, Olivier Delattre1,2 and Isabelle Janoueix-Lerosey1
|
1 INSERM U830, Laboratoire de Génétique et Biologie des Cancers, Institut Curie, 26 rue d'Ulm, 75248 Paris Cedex 05, France
2 Institut Curie, Unité de Génétique Somatique, 26 rue d'Ulm, 75248 Paris Cedex 05, France
3 Institut Curie, Département de Pédiatrie, 26 rue d'Ulm, 75248 Paris Cedex 05, France
|
|
Abstract
Data
description
Data visualization
withing VAMP
Guidelines to visualize data:
Abstract
Somatically acquired chromosomal imbalances are a key feature of neuroblastoma (NB), a heterogeneous pediatric solid tumor. Among these alterations, genomic amplification targeting the MYCN oncogene, observed in about 25-30% of the cases, strongly correlates with advanced stages and poor outcome. In this work, we have used BAC/PAC and SNP arrays to characterize amplifications in neuroblastoma. 88 distinct BACs defining high-level amplification events were identified in 65 samples, including 43 tumors and 22 cell lines. Although the highest recurrence was observed on chromosome 2, clones on chromosomes 8, 12, 16 and 17 also revealed genomic amplification in several samples. A meticulous analysis of the 2p22-2p25 MYCN containing region indicated highly complex patterns in a number of cases. High-resolution SNP-arrays then allowed to further refine the mapping of 25 amplicons in 19 samples, either reducing the size of a single continuous amplicon or increasing the complexity by highlighting multiple non-contiguous regions of amplification.
Data
description
BAC/PAC arrays: Various versions of our genomic array, containing between 2855 and 3799 validated BAC/PAC clones, were used in this study. The construction of the array has been previously described (Idbaih et al, 2005). All clones were verified by end-sequencing before spotting, and their positions on the genome were determined by BLAT analysis on the March 2006 release of the human genome browser gateway (http://genome.ucsc.edu/). Array-CGH experiments were performed as previously described (Vincent-Salomon et al, 2007).
SNP arrays: The SNP Affymetrix GeneChip Mapping 100K Set, comprising two 50K SNP microarrays, each array being based on specific restriction enzymes (XbaI or HindIII), was used according to the methods described by the manufacturer. The 100K set Combination of both arrays provides the DNA copy number of more than 115,000 SNPs. The arrays were scanned with an HP scanner (Hewlett-Packard Palo Alto, CA) to generate the cell intensity files. These files were normalized and the DNA copy number subsequently determined using the ITALICS algorithm developed by the Bio-Informatic unit at Institut Curie (Rigaill et al., submitted).
Data corresponding to these experiments are visualized using VAMP (Visualization and Analysis of CGH array, transcriptome and other Molecular Profiles; La Rosa et al, 2006) and organized into 4 folders:
The BAC-array/cell lines
folder contains the BAC-array CGH profiles for the 22 NB cell lines.
The BAC-array/tumors
folder contains the BAC-array CGH profiles for the 43 NB tumors.
The SNP-array/cell lines
folder contains the SNP-array CGH profiles for 6 NB cell lines.
The SNP-array/tumors
folder
contains the SNP-array CGH profiles for 13 NB tumors.
Each
folder includes 2 subfolders, “arrays”
and “chromosomes”
that enable the visualization of the whole genome profiles or the
visualization of only a selected chromosome, respectively.
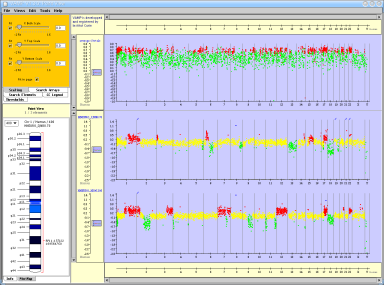
Data visualization
within VAMP
You have to launch the VAMP interface clicking the button below:
Warning: configure your java
virtual machine according the following
instructions. Your browser must allow java to be used.
Guidelines to visualize data
Some guidelines are given below to help the user visualizing the data
within VAMP interface:
1 - BAC arrays
Import BAC arrays data
File
-> Import -> BAC-array/cell lines (or BAC-array/tumors) folder -> Arrays
Select the arrays and then click on Import data
Increase the scale in Y and X axis (Zooming item)
Add the results of the analysis by the GLAD algorithm (Hupé et al, 2004)
View
-> Current View -> Show smoothing line
By default, the colour legend item (Linear CGH) is the following:
- Amplicon: 3 - blue
- Gain: 1.4 - red
- Normal Max: 1.1, Normal Min: 0.9 - yellow
- Loss: 0.6 - green
The default behaviour is to plot the data in Ratio. If you want to Switch to log Ratio then:
Edit
-> Select All
Tools
-> CGH -> Change CGH Ratio to LogRatio
2 - SNP arrays
Import SNP arrays data
File
-> Import -> SNP-array/cell lines (or SNP-array/tumors) folder -> Arrays
Select the arrays and then click on Import data
Increase the scale in Y and X axis (Zooming item)
Add the results of the analysis by the GLAD algorithm (Hupé et al, 2004)
View
-> Current View -> Show smoothing line
By default, the colour legend item (Linear CGH) is the following:
- Amplicon: 3 - blue
- Gain: 1.4 - red
- Normal Max: 1.1, Normal Min: 0.9 - yellow
- Loss: 0.6 - green
The default behaviour is to plot the data in Ratio. If you want to Switch to log Ratio then:
Edit
-> Select All
Tools
-> CGH -> Change CGH Ratio to LogRatio
|
The breakpoints
detection has been performed using the GLAD
algorithm
|
|
To download the java plugin click
here